Classifiers Quality, Difficulty & Partials
One of the interesting new metrics I’ve implemented on HitFactor.info is a Difficulty metric, obtained by comparing the fitted Weibull distributions of different classifiers (or divisions).
By converting the Hit Factor into a percentage of the Recommended High Hit Factor (Rec. HHF), the distributions of scores across different stages become comparable, resulting in a visualization like this:
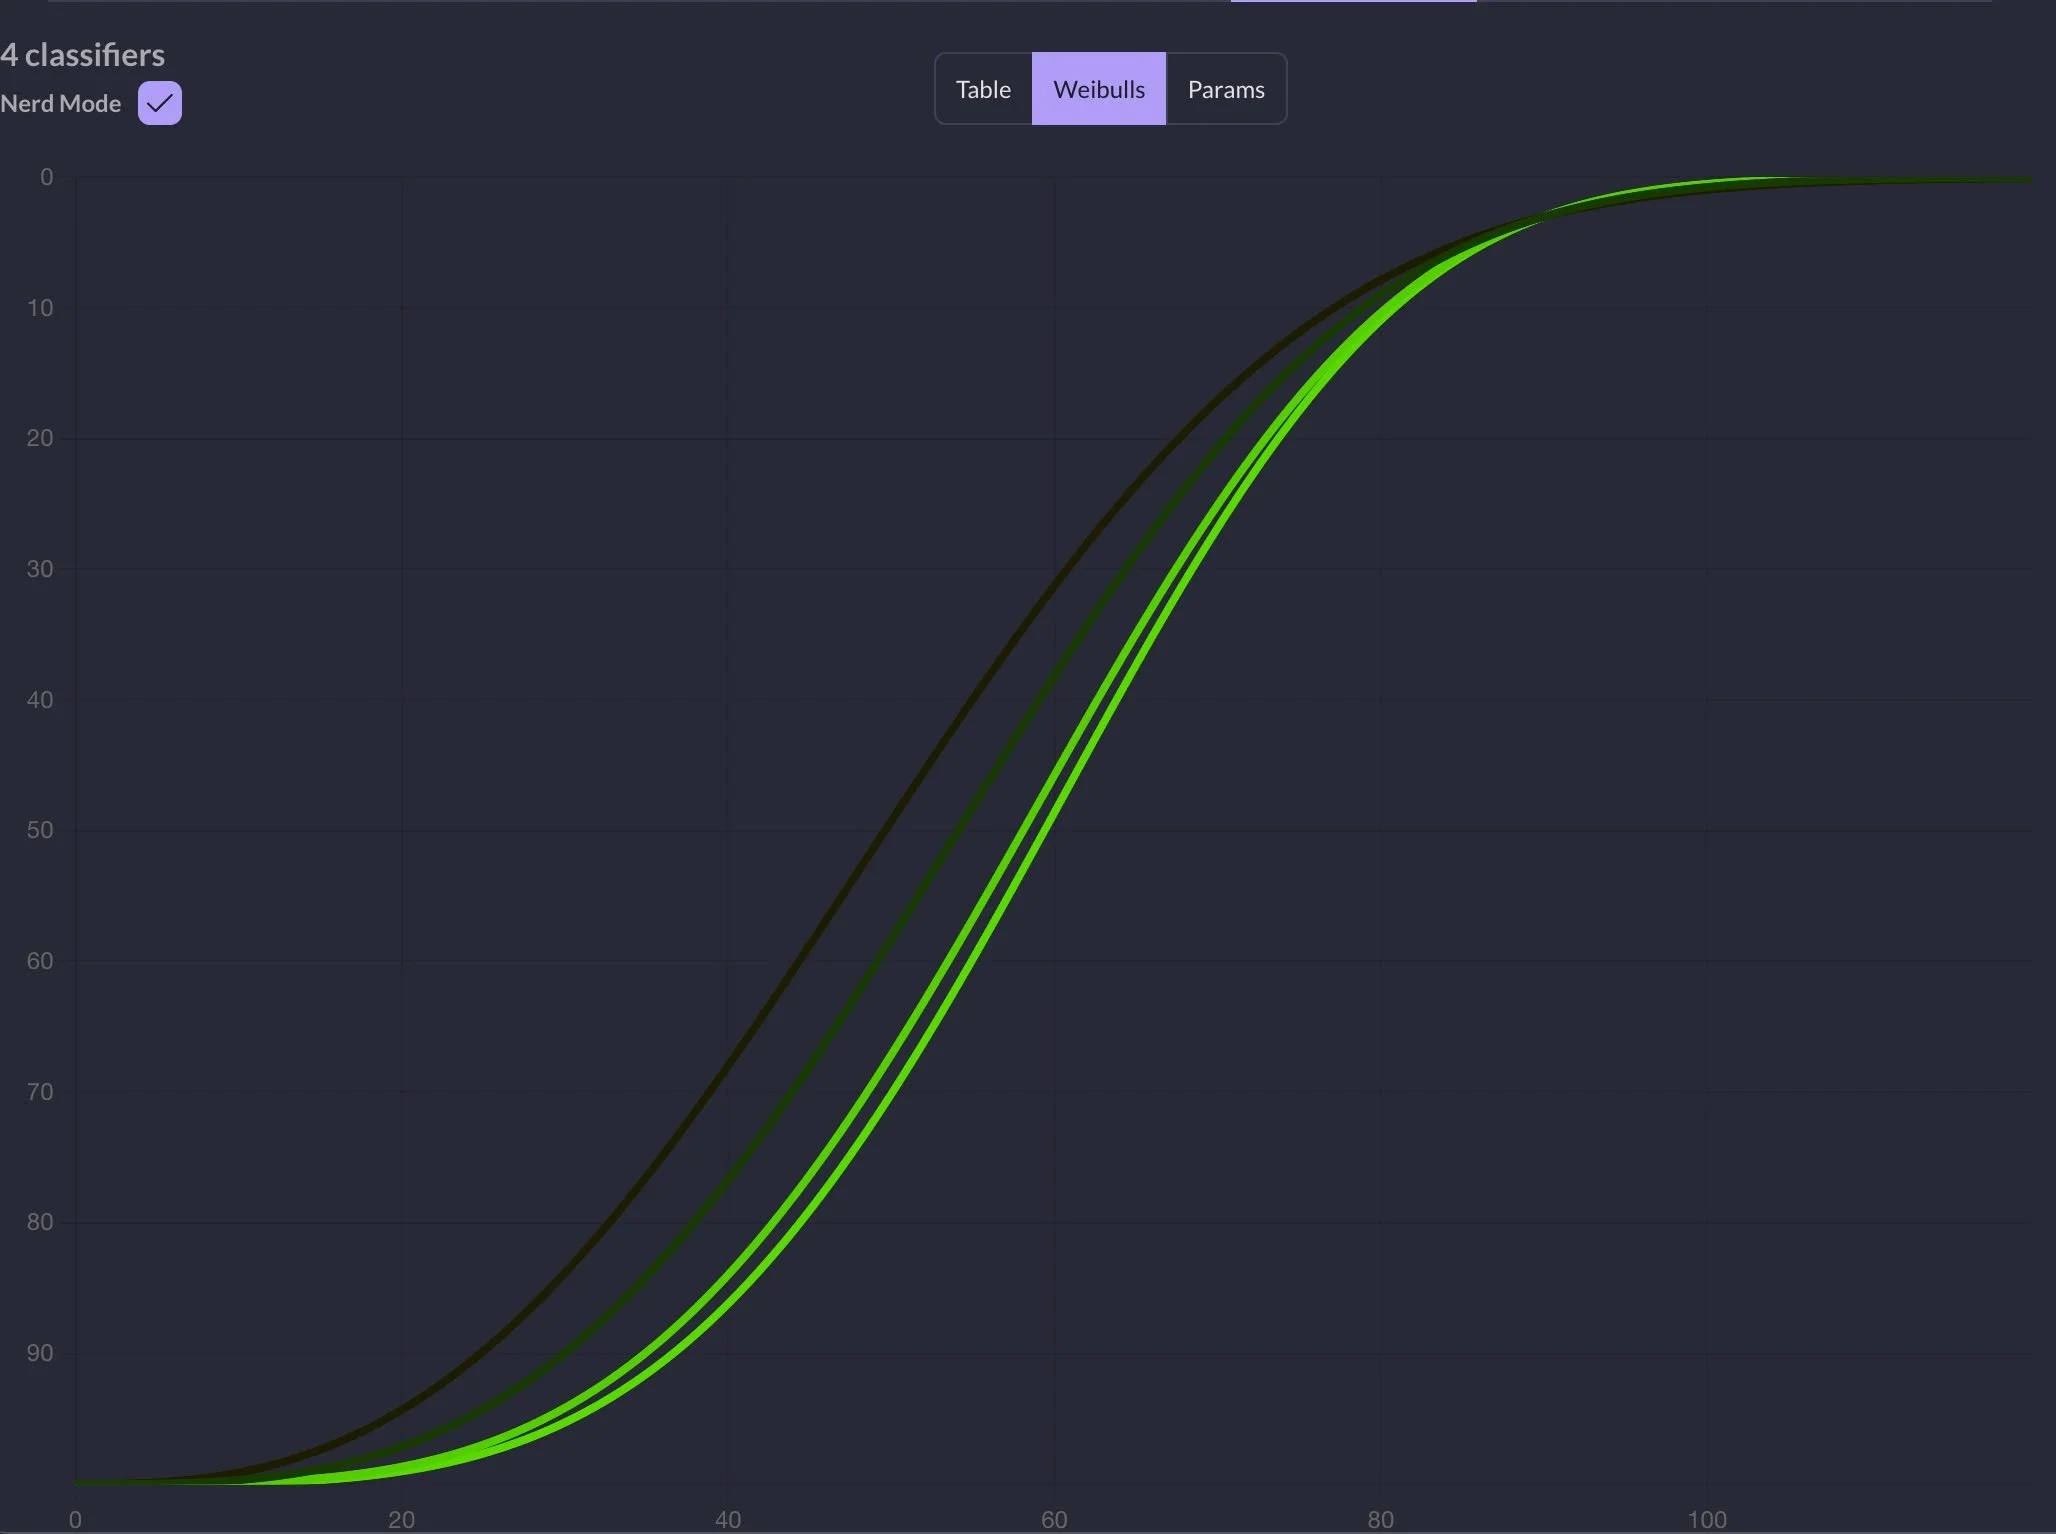
Fitted Weibull Distributions of 99-11 “El Presidente”, 99-22 Nuevo El Presidente, 24-08 And now for something completely different, and 25-01 Return to Monke. The darkest line on the left is 99-22, followed by dark green 99-11, and then two bright green ones for 24-08 and 25-01.
The color of the lines represents the Quality Rating of each individual classifier, which is primarily driven by its correlation to Major Match performance. A brighter green indicates a higher Quality rating, while a darker color indicates a lower one. As we can see here, both El Presidente and Nuevo El Presidente are harder and correlate less with Major Match performance when compared to more "stage-like" classifiers, such as 24-08 and 25-01.
What is most interesting for our analysis of Difficulty and Quality, however, is that 99-22 is significantly worse than 99-11 in terms of both metrics.
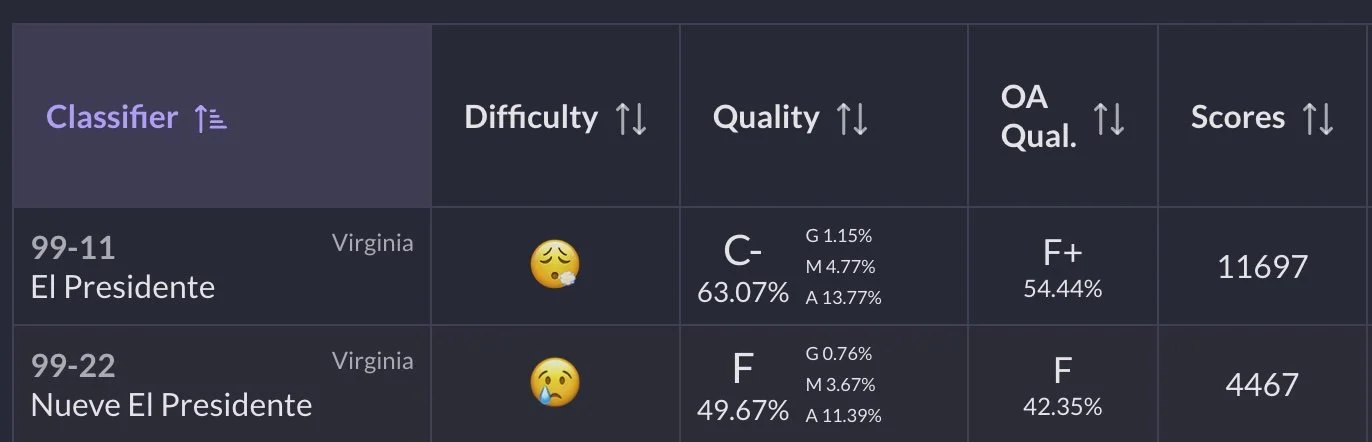
Comparison of 99-11 and 99-22 in Carry Optics division
But where does that difficulty rating come from?
Essentially, it is a function of the shape of the distribution. As you can see on the previous chart, for the majority of percentage scores, the darker line for 99-22 lies to the left of (or above) 99-11. Practically speaking, this means that for any given percentage of the Recommended High Hit Factor (Rec. HHF), a smaller percentage of shooters are capable of achieving that score.
For the average shooter, this makes the classifier "harder." But what does this look like for high-level shooters?
To answer that, we need to zoom in.
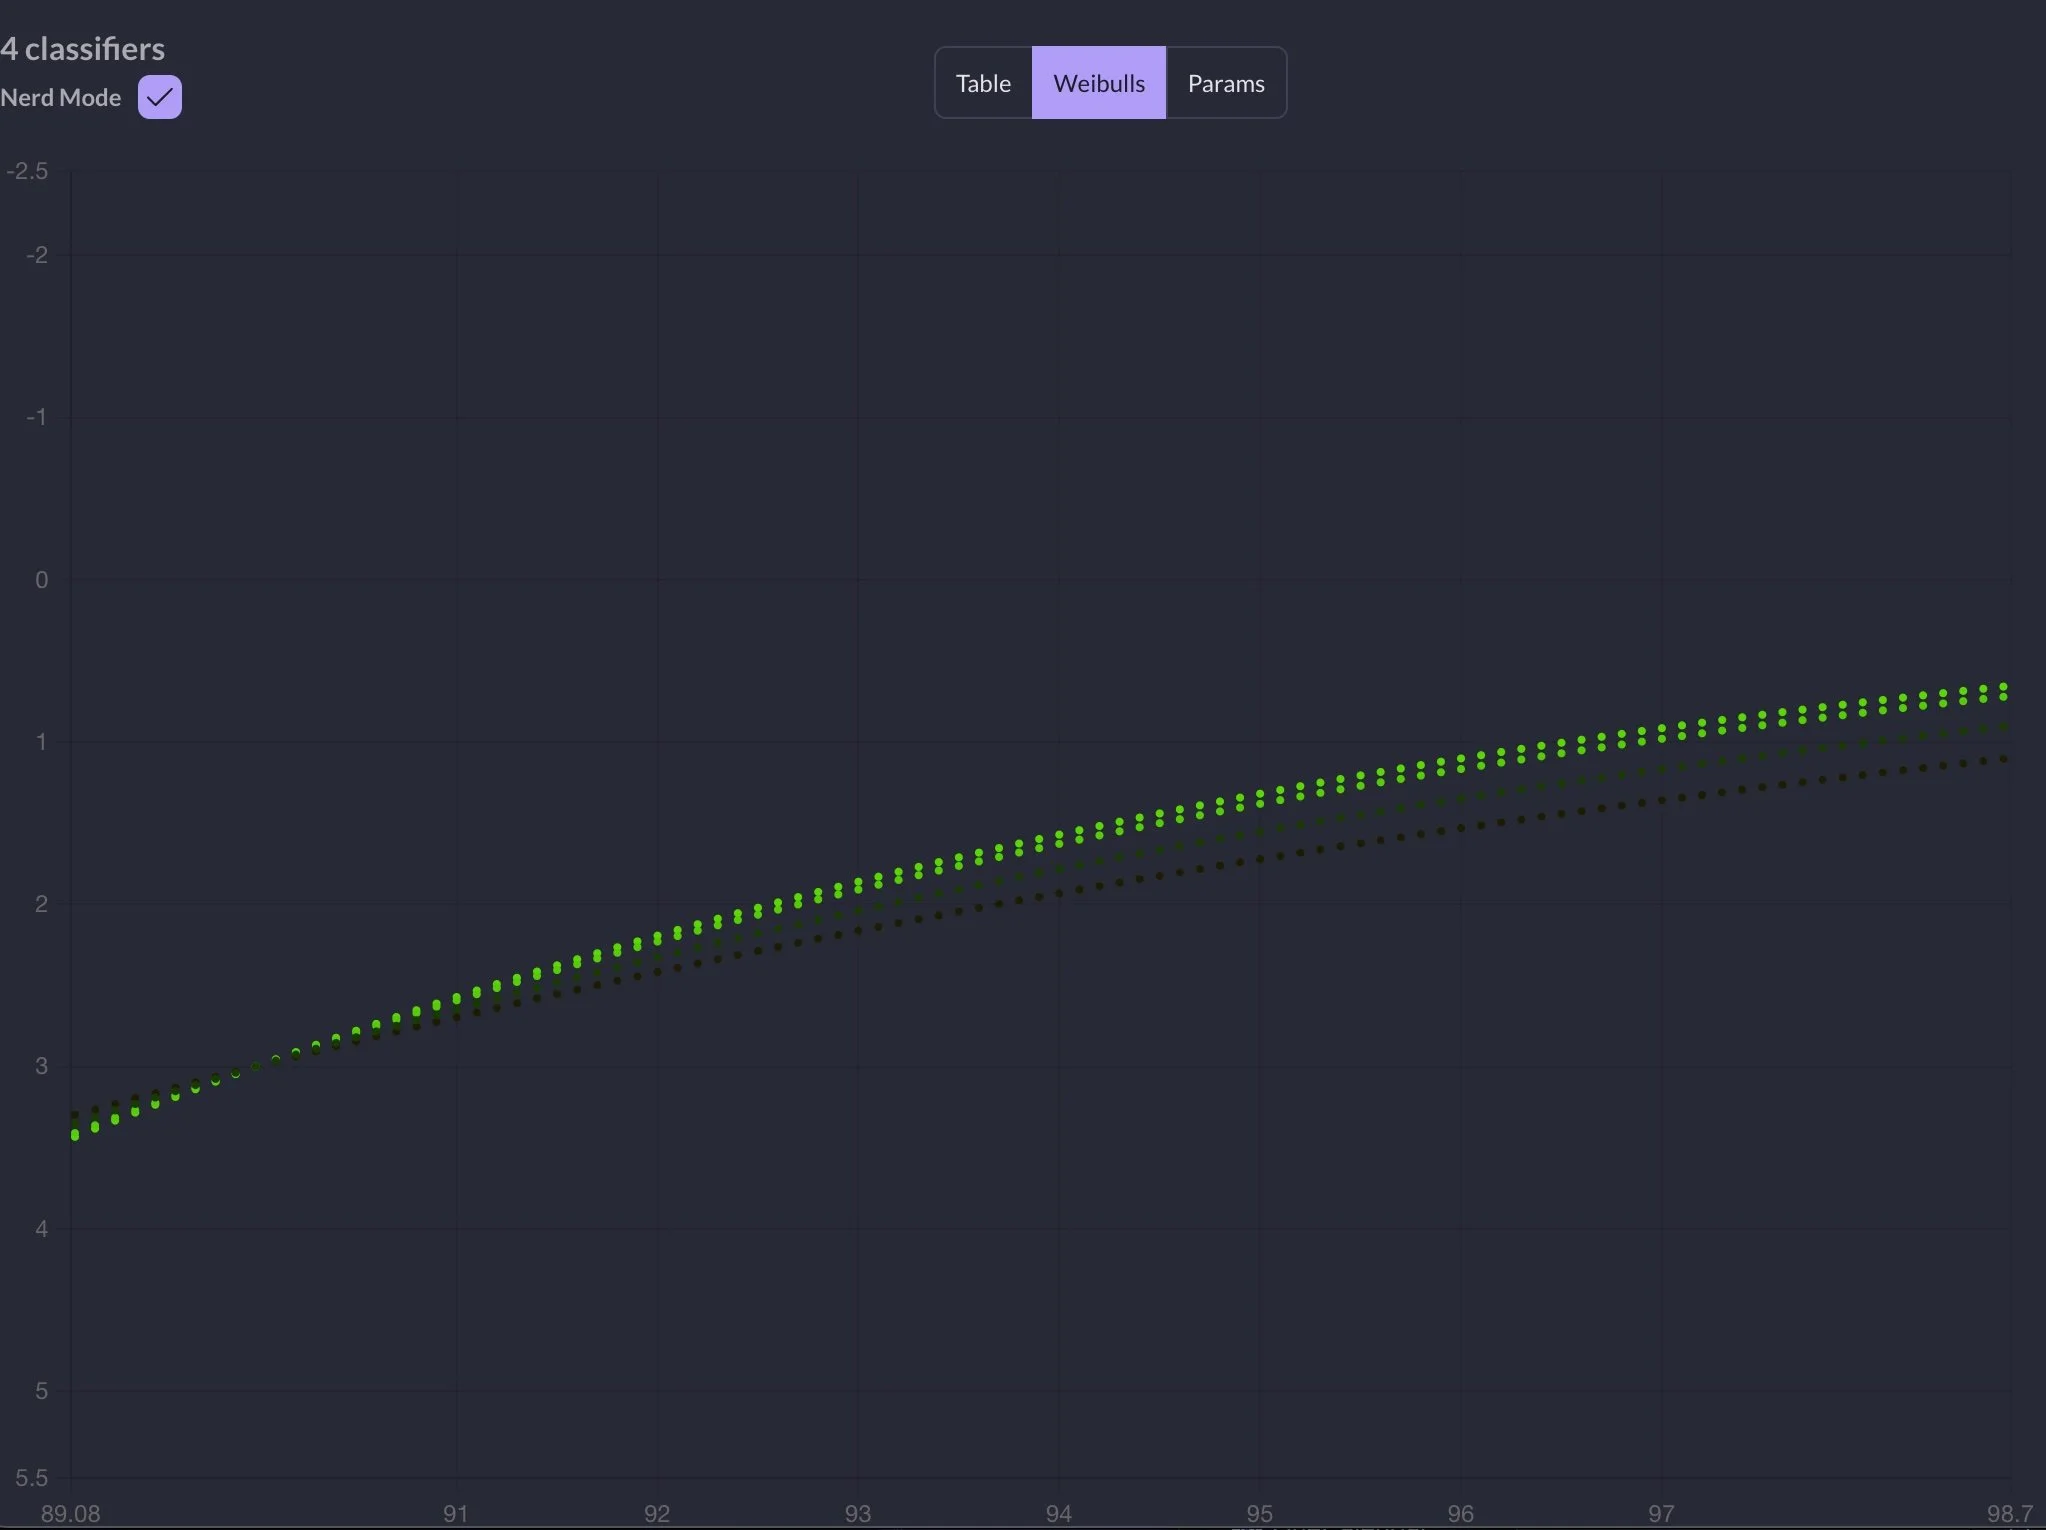
Fitted Weibull Distributions, zoomed in view.
As you can see, the difference here is much less pronounced. After all, to score higher than 90% of the Rec. HHF (or in the 97th percentile of scores), you need to be a high-level shooter, and the population sizes in this bracket are quite small. However, the relationship between classifiers here flips: better classifiers actually have fewer shooters past the calibration point (97th/90%) than the worse ones.
Obviously, this is due to the nature of the Weibull distribution and the calibration point we’ve chosen to convert non-linear percentiles to linear, percentage-based scores. But it is also a good indicator that for absolute top shooters, it doesn’t really matter if a classifier is difficult or not; they will still find a way to get ahead of the competition. On harder classifiers, the gap at the top will simply appear smaller than it truly is.
So, where does this leave us in terms of 99-11 vs. 99-22 and partials? The only difference between 99-11 and 99-22 is that the latter features partial targets; everything else remains the same. If 99-22 were simply a harder version of 99-11, the distributions should look identical after normalizing the scores to a percentage.
Yet, they don’t. Furthermore, the real-world data (the actual score data points rather than the fitted Weibull distribution) demonstrates much lower normality, especially along the left tail of the Cumulative Distribution Function (CDF).
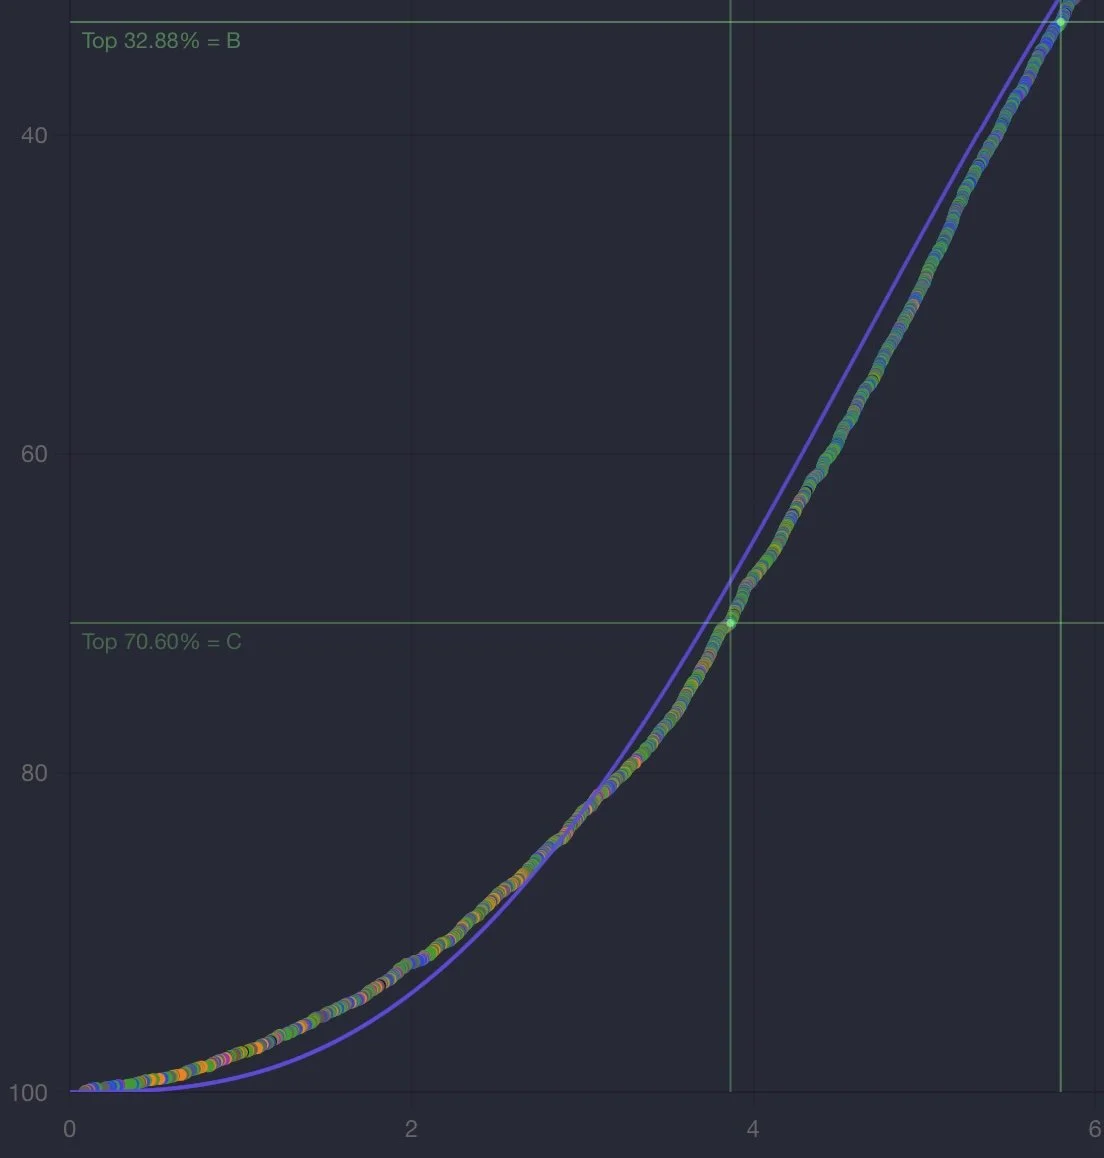
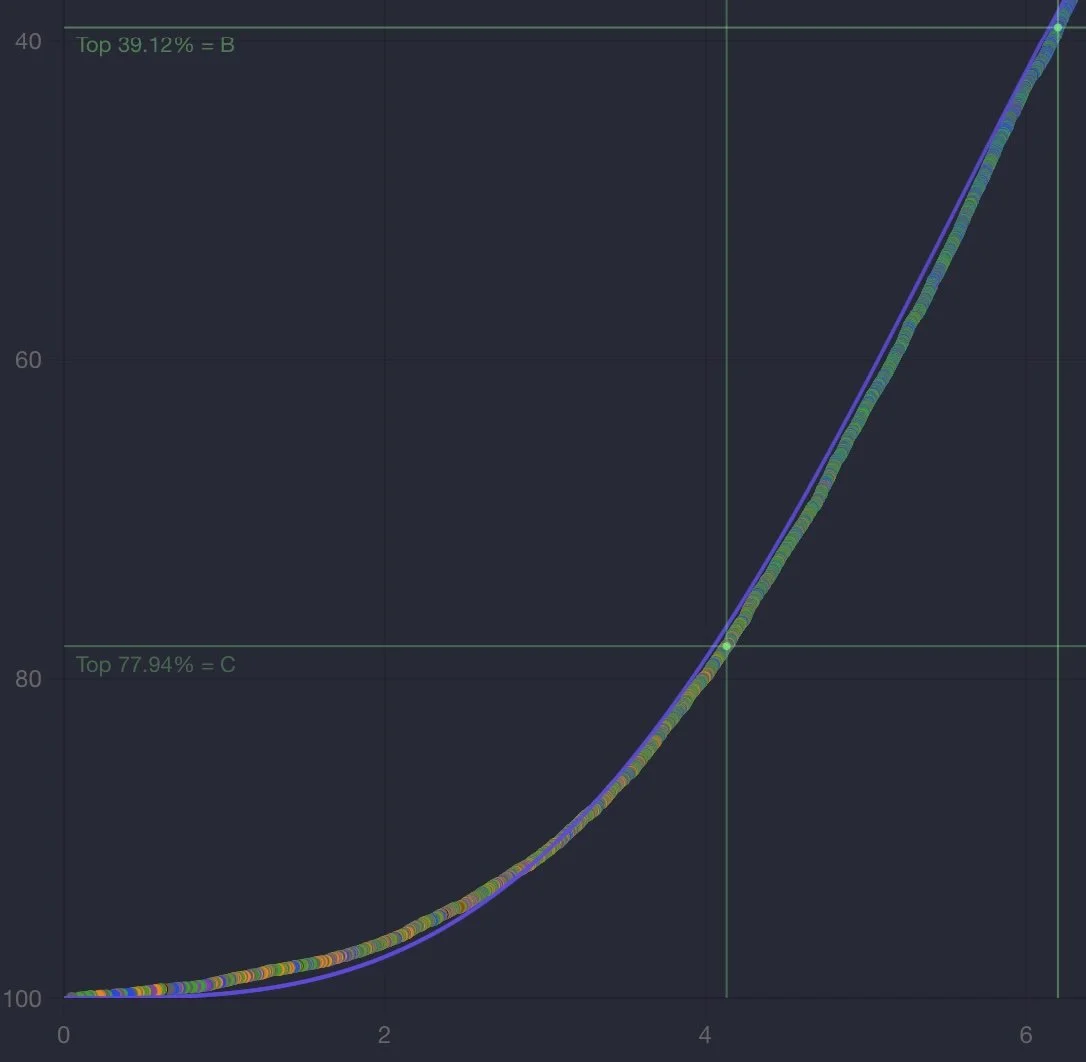
99-22 Nuevo El Presidente. Real Data Distribution, notice the deformation on the left tail of the CDF.
And now compare this to the same section of the 99-11 El Presidente distribution:
99-11 El Presidente. Real Data Distribution.
It is much smoother! The reason here is obviously all the “failed” attempts with Mikes and No-Shoots, that threw average shooters into much lower percentage populations, decreasing normality of the data, and making 99-22 worse at measuring shooter’s skill level than 99-11.
Summary
Classifier Quality varies depending on how well scores correlate to a shooter’s major match performance and overall classification percentage.
Classifier Difficulty varies depending on the shape of the distribution; it can be defined as the average score as a percentage of the Recommended High Hit Factor (Rec. HHF).
Easier classifiers are generally "better" than harder ones.
Partials, Virginia Count, Weak Hand Only (WHO), Strong Hand Only (SHO), and Mandatory Reloads make classifiers harder.
Most stages in Major Matches do not feature Virginia Count, WHO, SHO, or Mandatory Reloads. This causes classifiers containing these elements to correlate poorly with match performance, resulting in lower quality compared to more "stage-like" classifiers.